web platform
Designing features that stayed.
The product
Gazelle is Tierra's telematics platform for connected vehicles, designed for fleets moving on the road across rental, insurance, finance, services and logistics. A multitenant, multiregion B2B SaaS used by enterprise clients to manage cars, vans, trucks, scooters and their attachments. "Go, with confidence" is the platform's promise to its users.
MY ROLE
I joined an established product team to design UX flows for new features, applying an existing visual system and partnering closely with developers from requirements review to release testing. Research and requirements were defined by project managers. My work began when the "what" was settled and the "how" needed designing.
tIMELINE
Five years of continuous contribution from 2020 to 2025, spanning multiple feature releases across all five Gazelle verticals.
Five years of feature design taught me that the real work happens between the disciplines. In the conversation with developers, in the third iteration of a flow, in the Jira ticket that catches something nobody noticed. Here's how I approached it.
01 - requirements
Reading the brief, mapping the implications
Requirements analysis
Edge case mapping
System dependencies
02- ux
Designing the flow, then defending it
User flows
Interaction design
Dev collaboration
03 - UI & HANDOFF
Applying the existing system, with discipline
Existing design system
UI consistency
Detailed handoff
04 · TESTING
Catching what fell through the cracks
Alpha testing
Jira
Dev sync
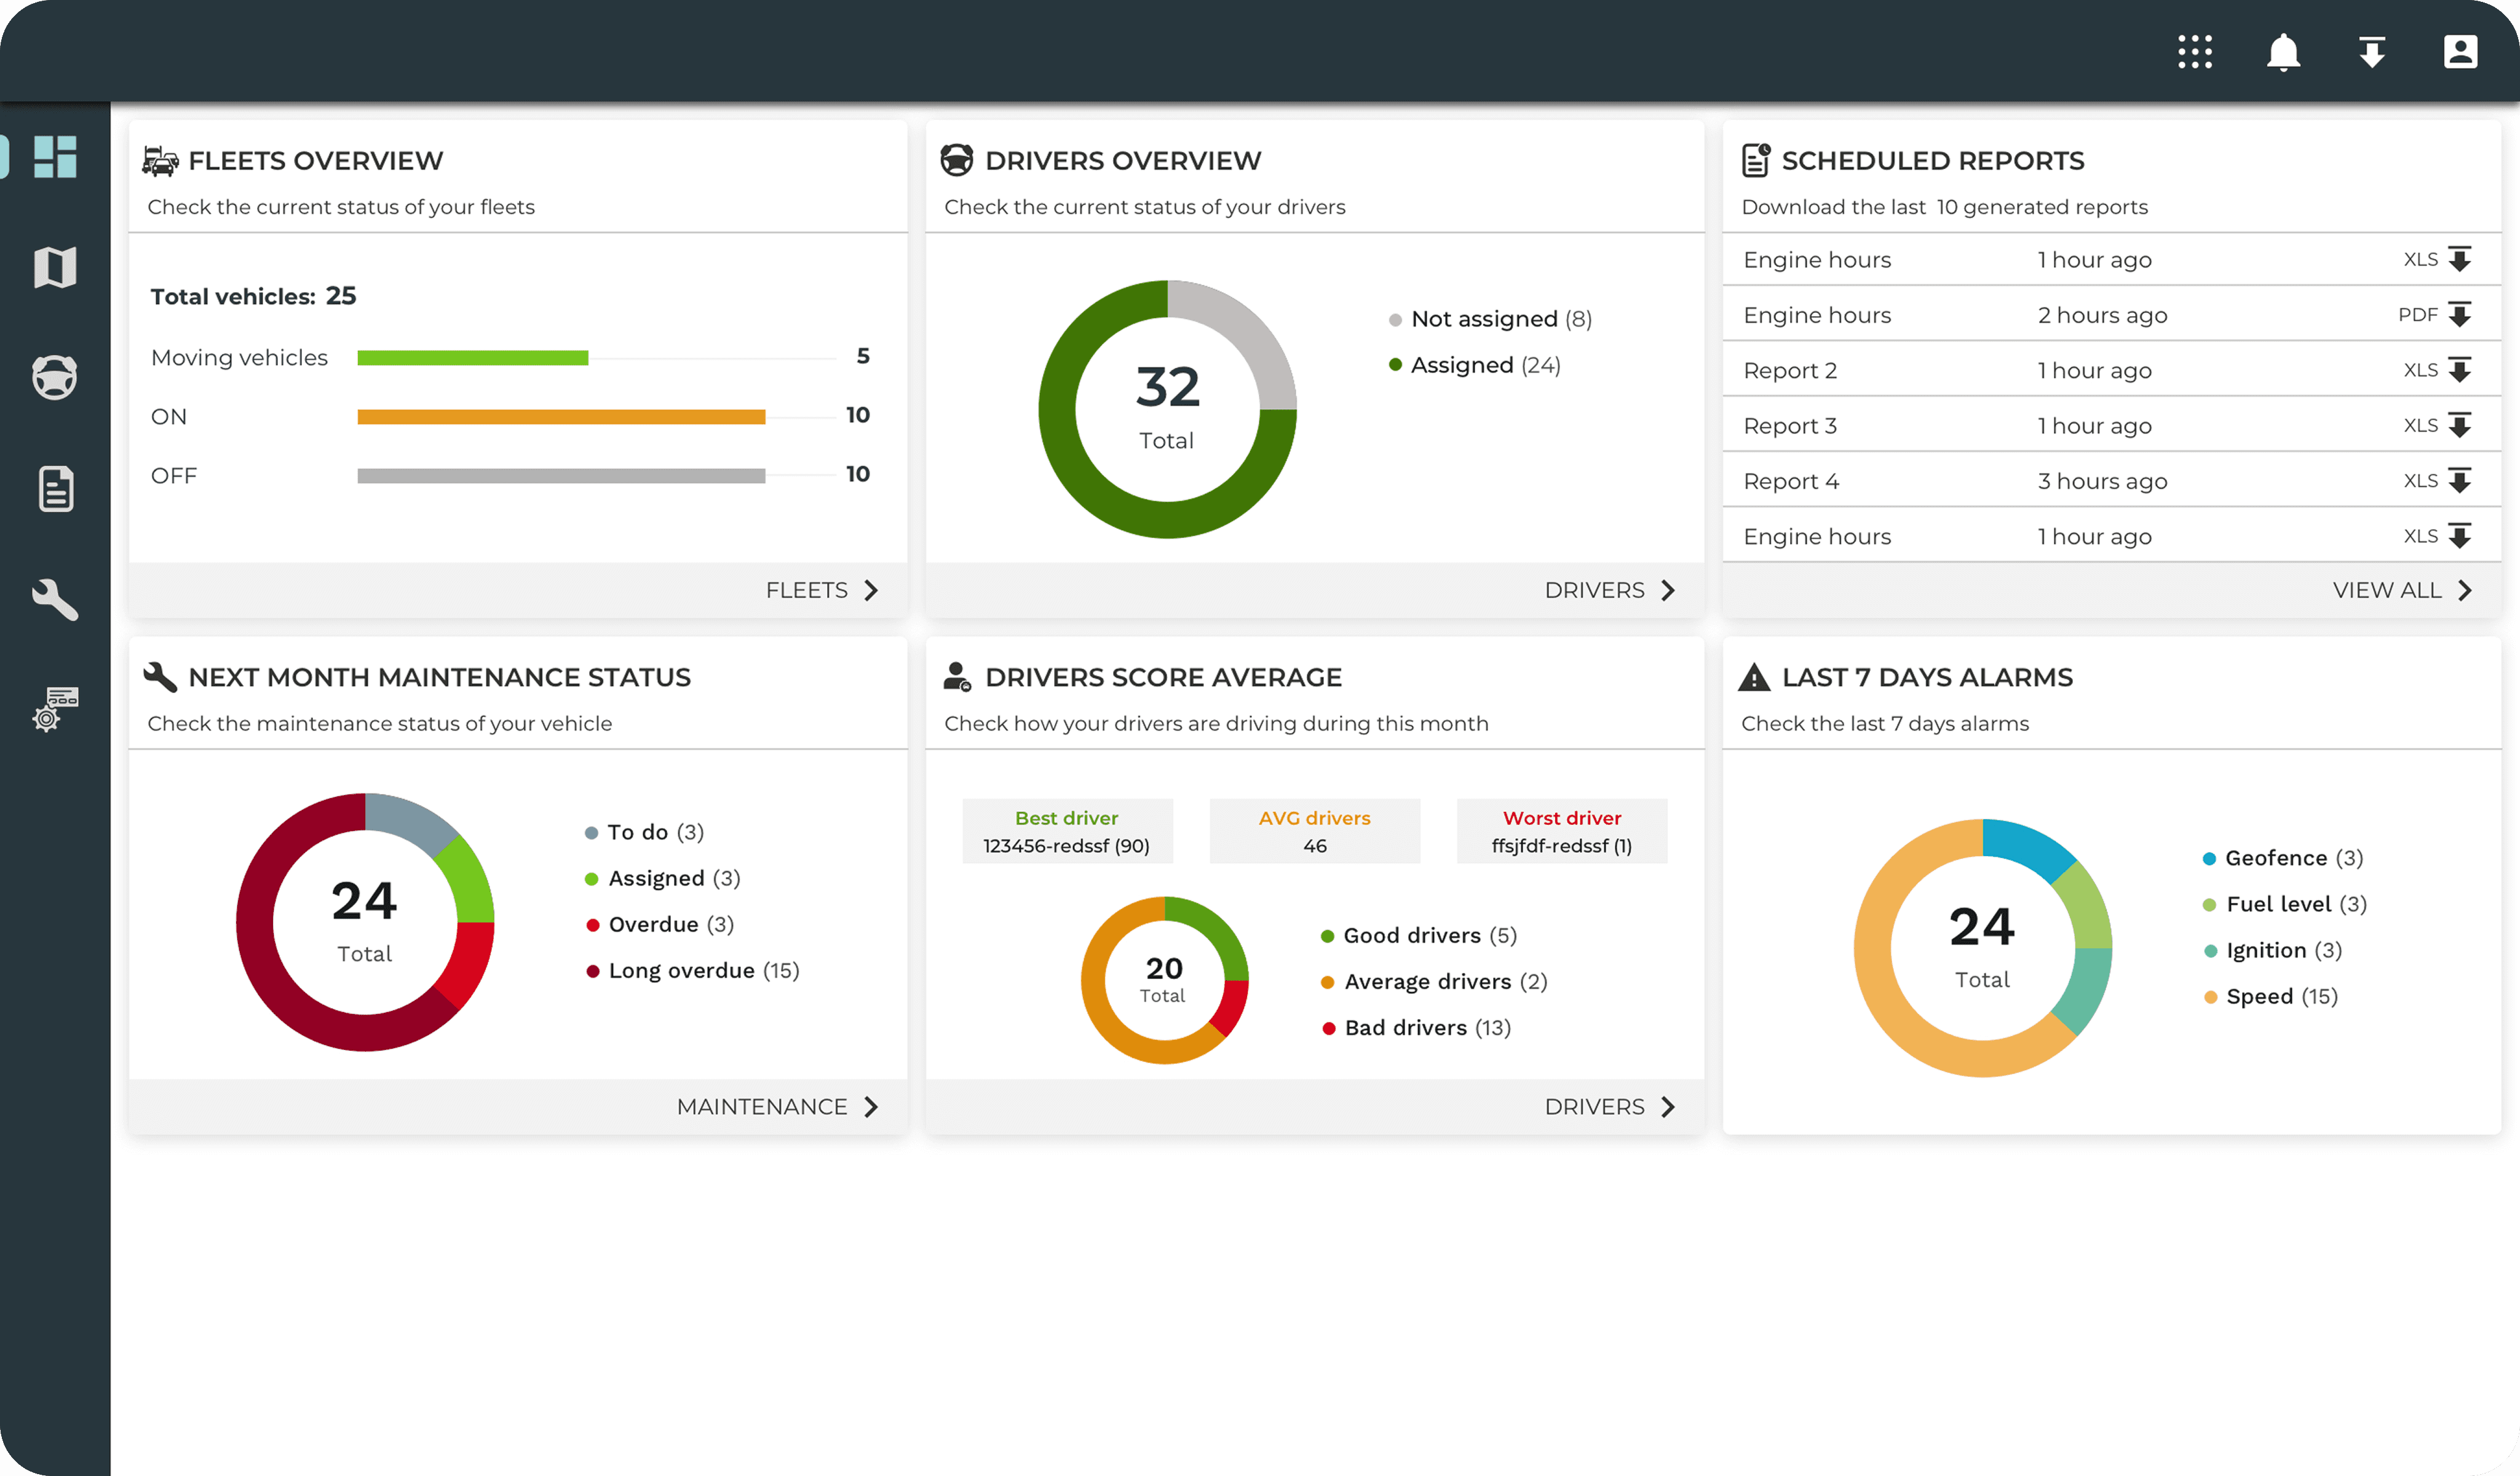
01 • Dashboard
Meaningful information at a glance, informed decisions in your hands. The dashboard delivers a live view of the fleet, covering assets, vehicle health, driver activity and alerts. Designed to be readable in seconds and adaptable to the priorities of each vertical, from rental to logistics.
MY CONTRIBUTION
Designed the dashboard layout and its widget system, defining the information hierarchy so the most critical fleet data surfaces first, and making the layout adaptable to the priorities of each vertical, from rental to logistics.
02 • Live map & fleet panel
GPS Live Tracking shows where every vehicle is in real time, paired with a contextual side panel listing each asset across the fleet. Selecting a vehicle on either surface, map or list, updates the other, keeping operators in sync as they monitor distributed fleets across regions.
MY CONTRIBUTION
Designed the map ↔ panel interaction model, asset clustering logic for high density zones, and the detail behavior when an asset is selected.
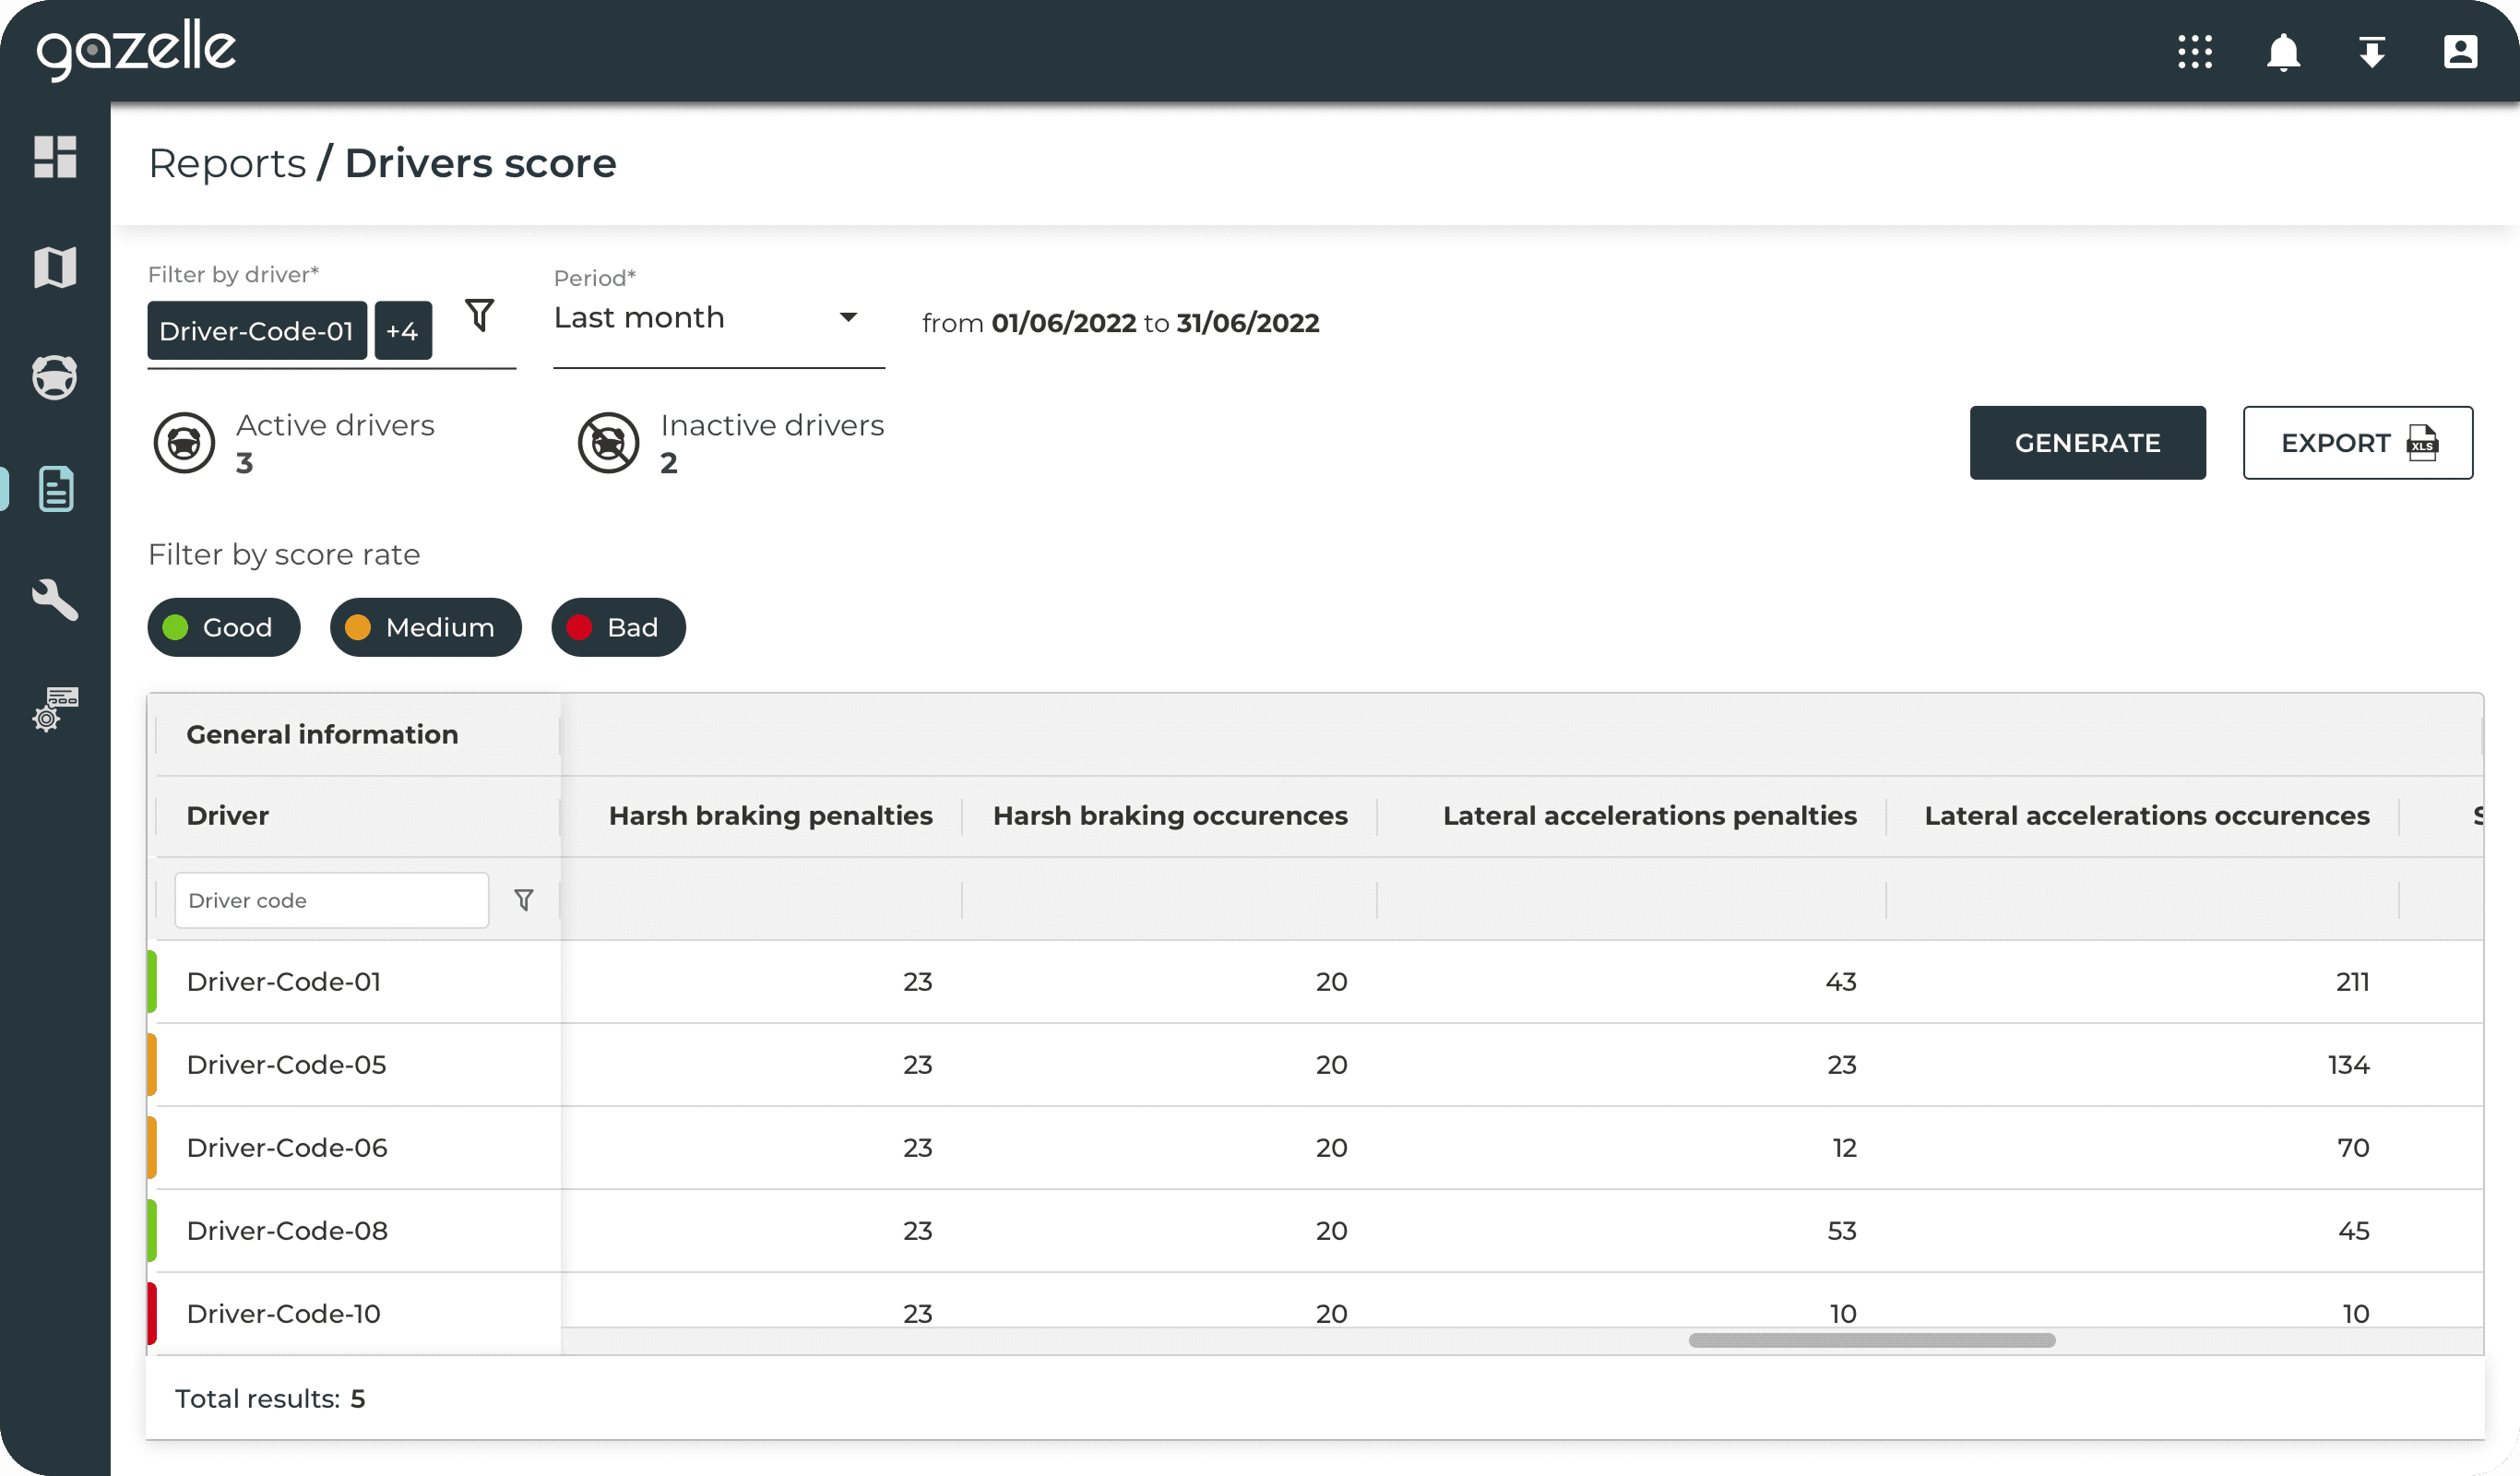
03 • Scorecard
Sudden acceleration and harsh deceleration can compromise vehicle safety and signal where driver behavior could improve. The Score Card surfaces those moments, giving fleet managers, insurance partners and finance companies the visibility to act on what was previously invisible.
MY CONTRIBUTION
Designed the score visualization, breakdown by behavior type, and the trend view that helps managers track improvement over time.
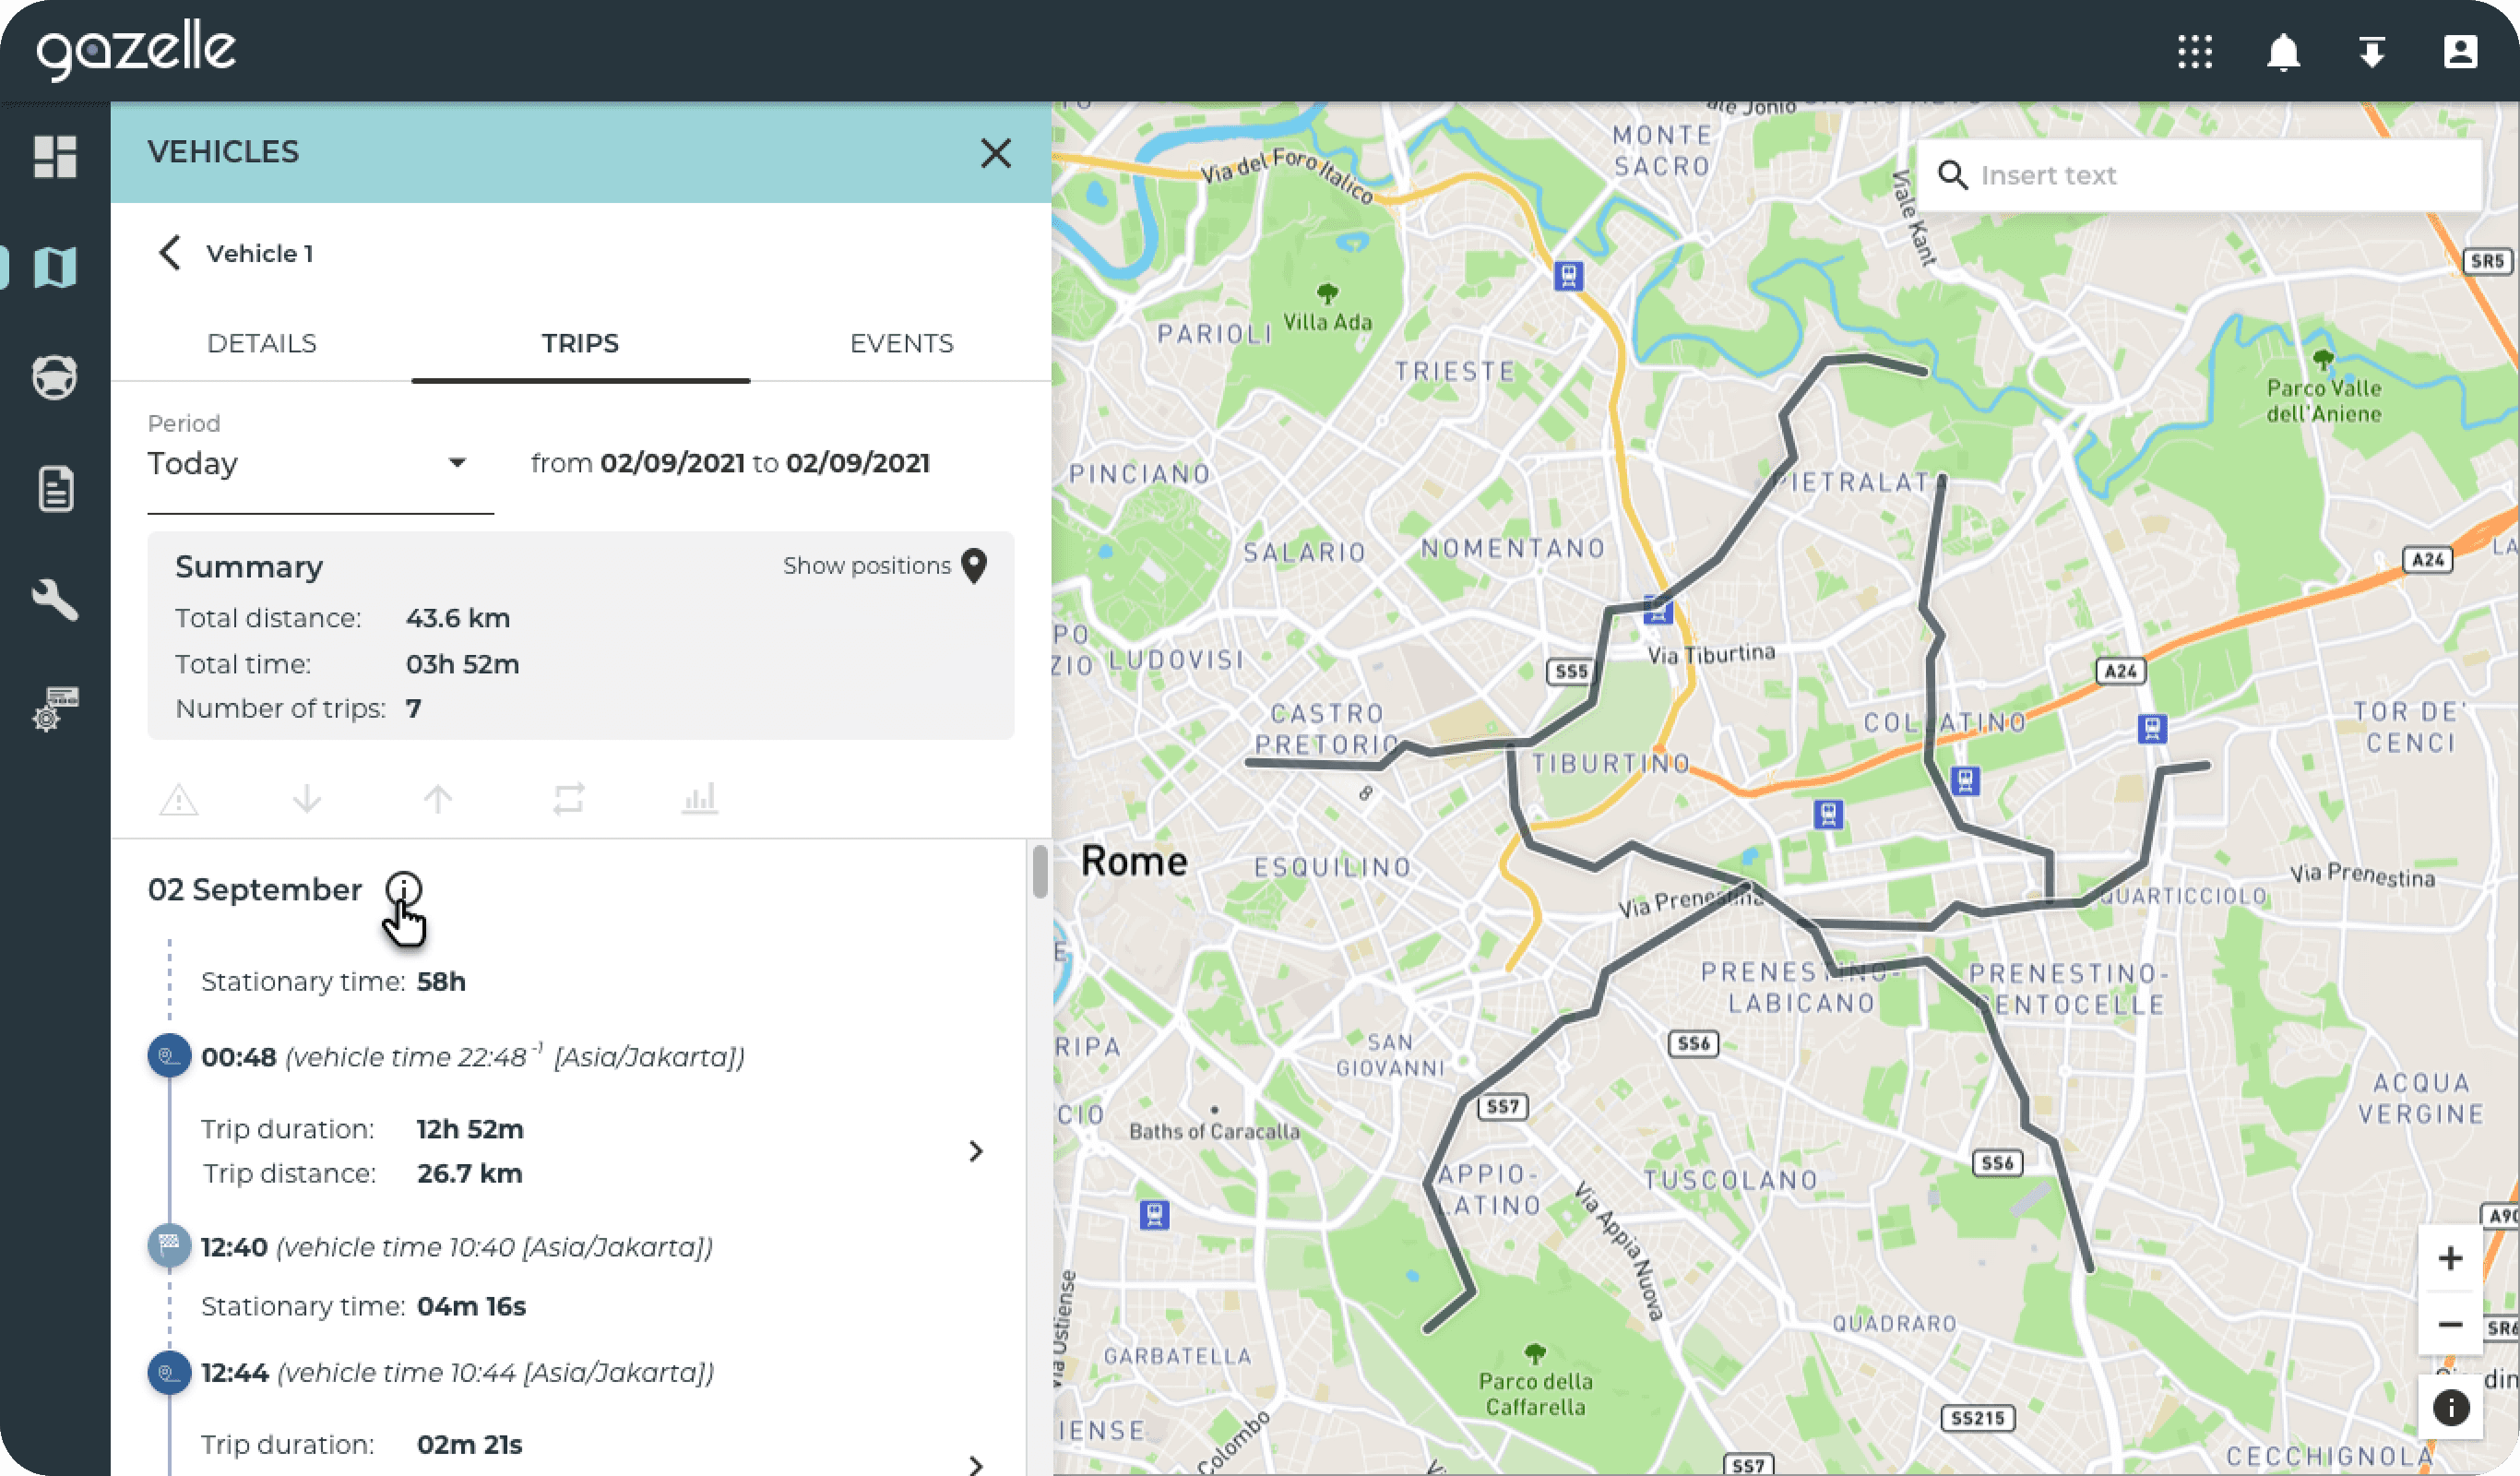
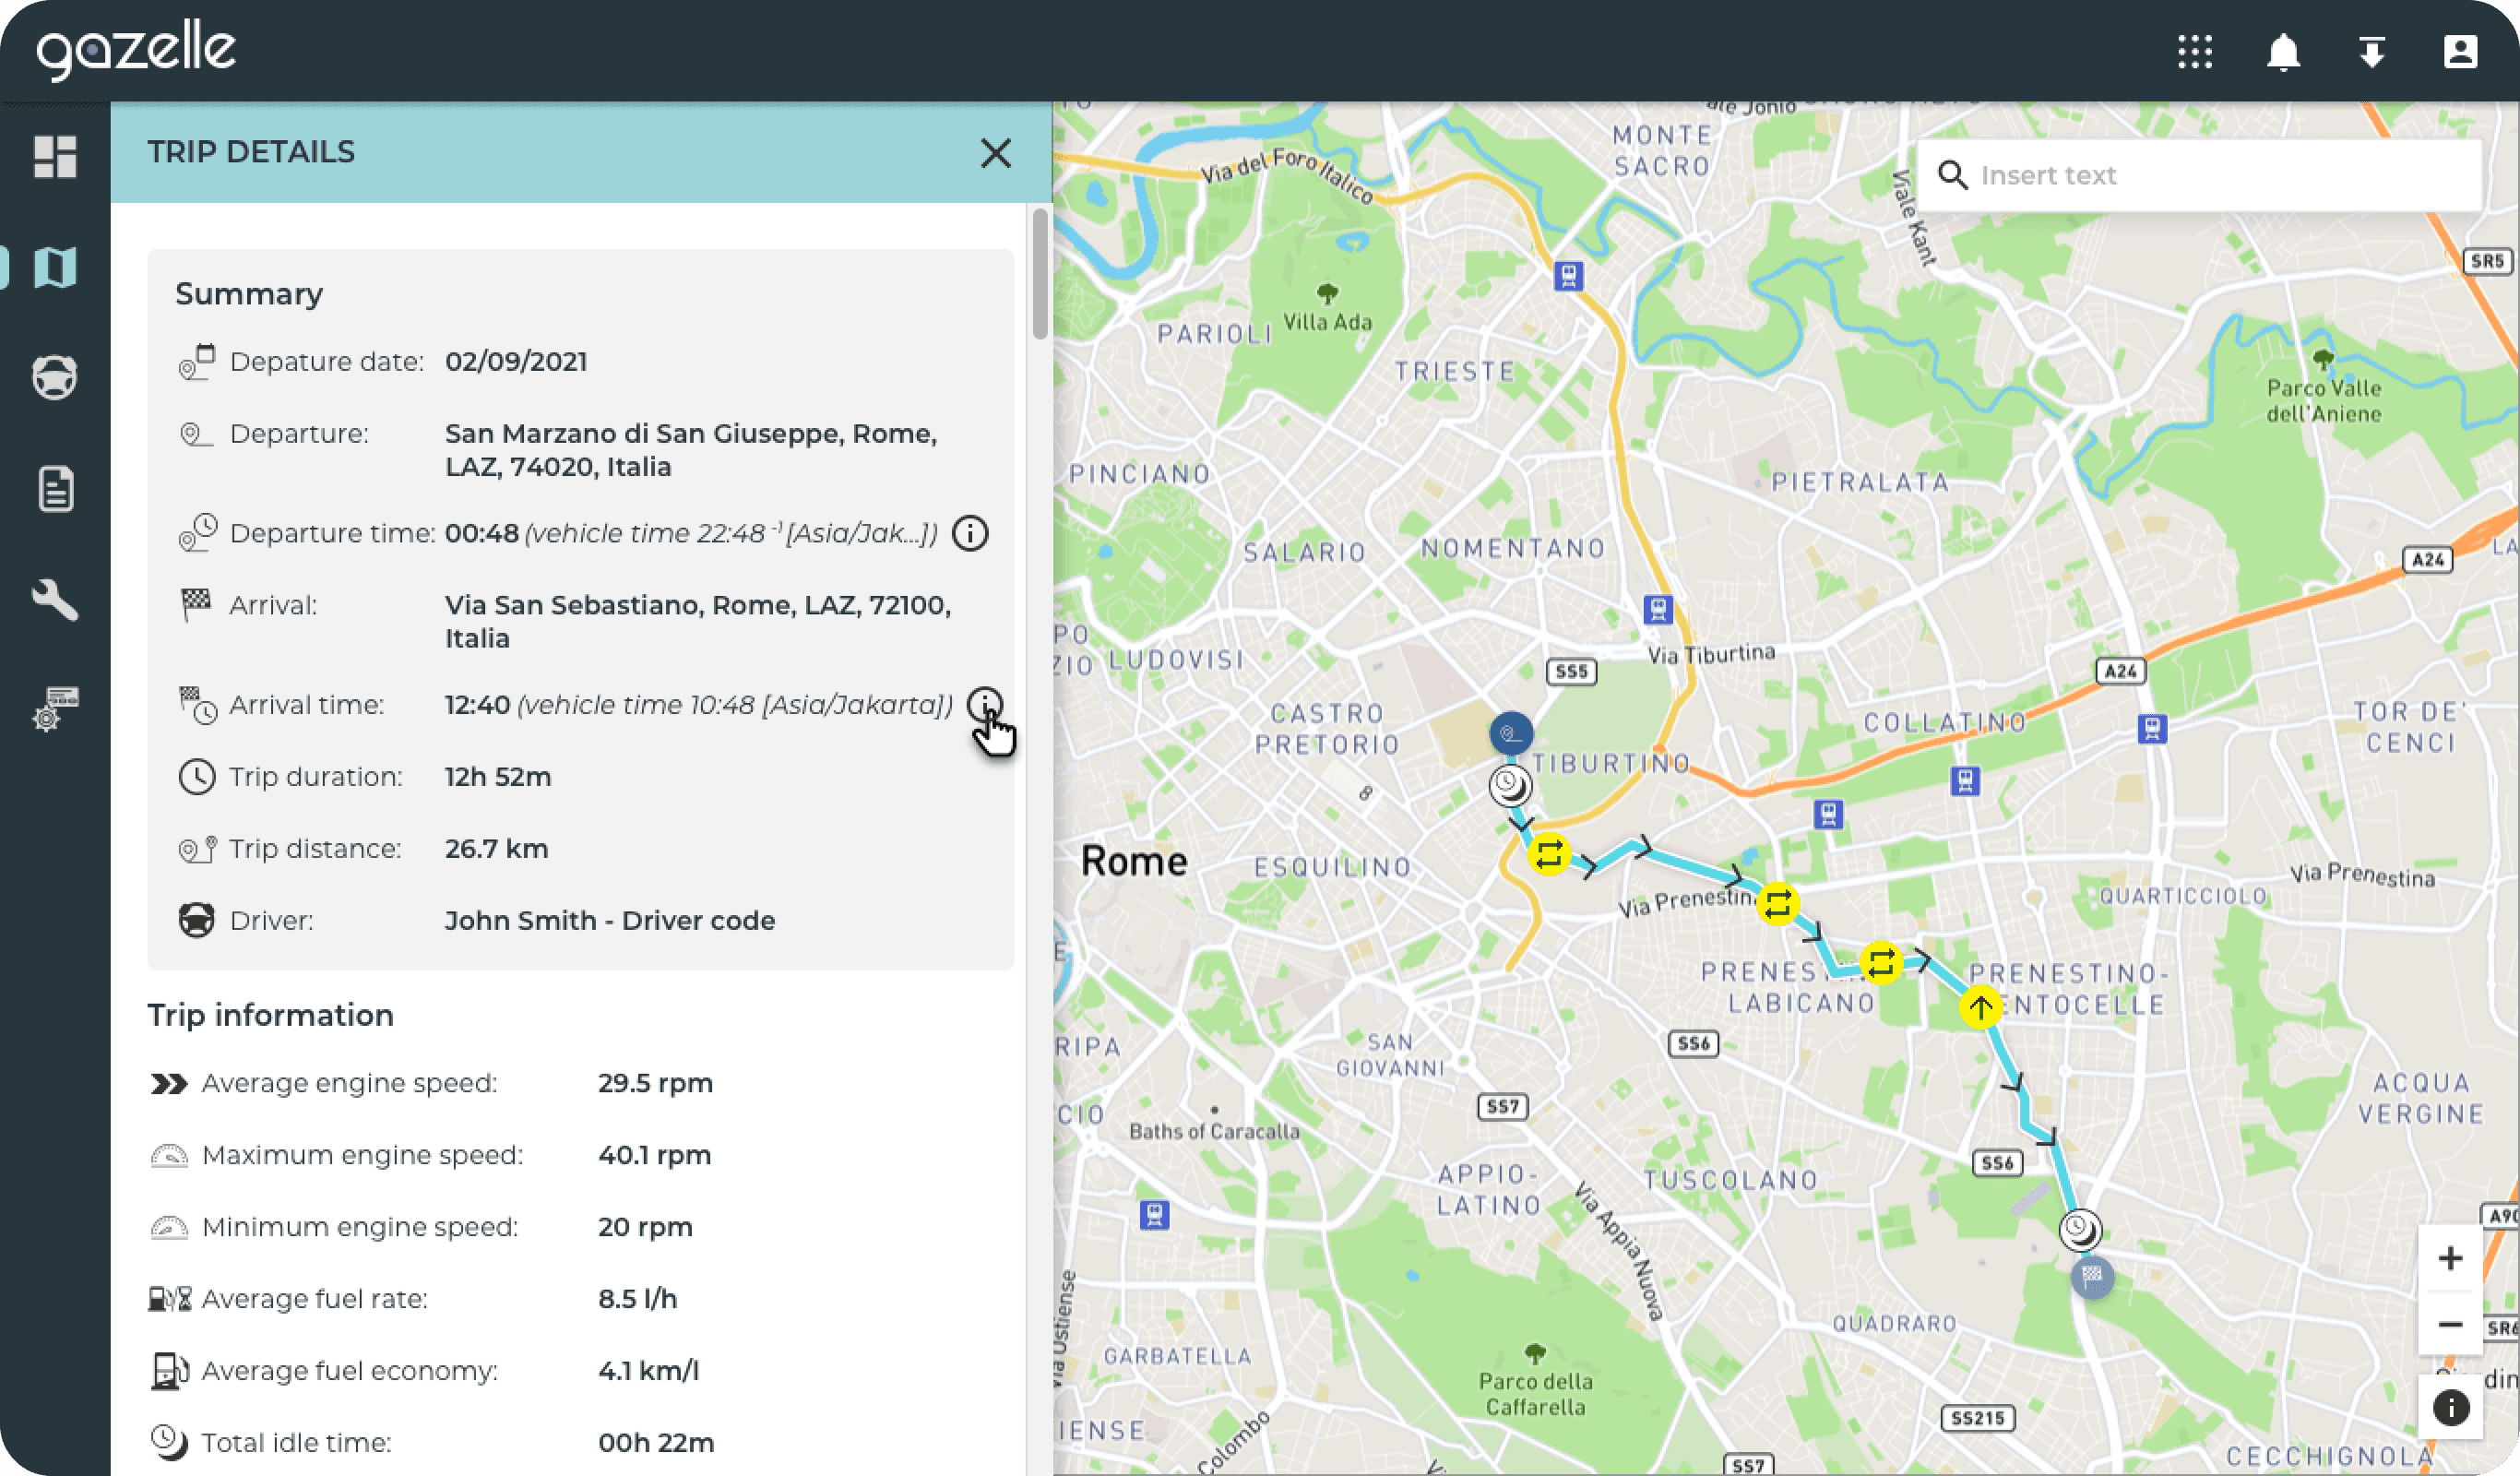
04 • Historical route playback
A time range player that replays vehicle movements on the map across any historical period. Useful for incident investigation, route optimization and post trip analysis. Operators can scrub through the timeline, zoom in on critical events, and inspect contextual data along the route.
MY CONTRIBUTION
Designed the time range controls, the playback interaction pattern, and the data overlay system that surfaces events as the vehicle moves through its historical path.
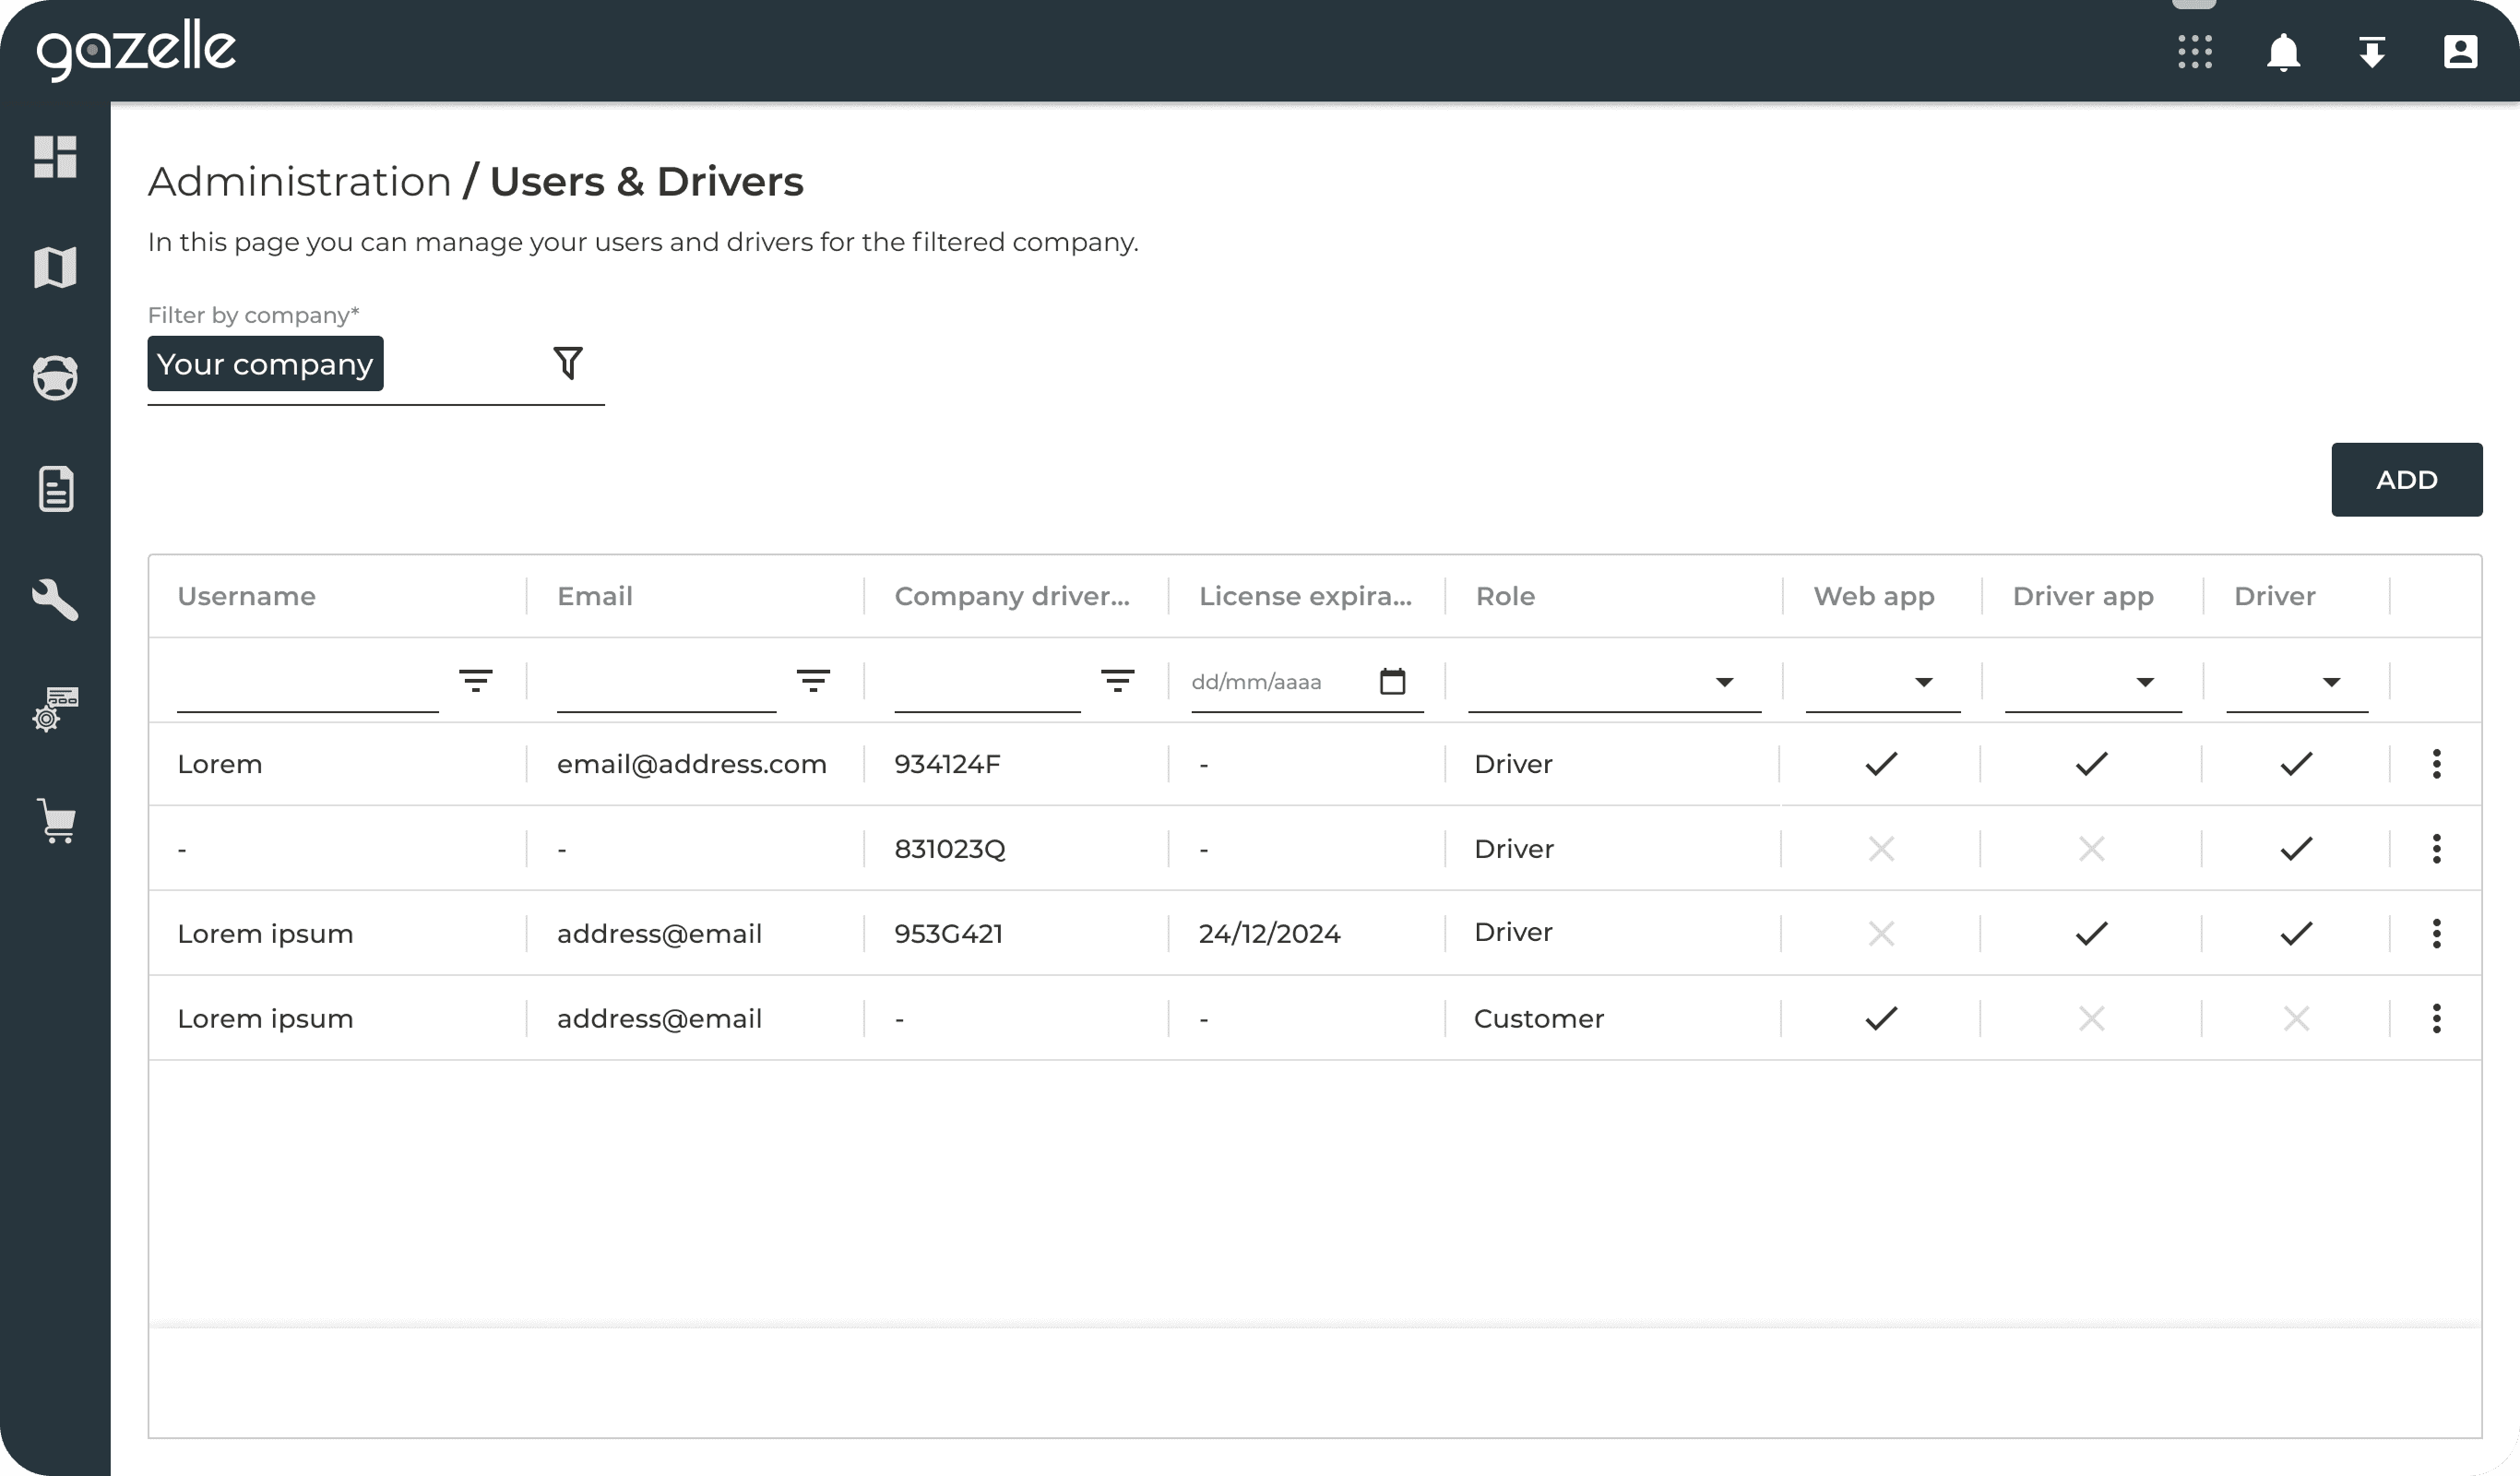
05 • Fleet administration
The administrative layer where fleet managers handle their assets, users and permissions at scale. Built to stay usable whether a client manages ten vehicles or ten thousand, across teams with different roles and access needs.
MY CONTRIBUTION
Designed the table interactions, filtering and bulk action patterns, plus the role based permission flows that handle access across a multitenant architecture, where the same admin tools serve clients with very different team structures.
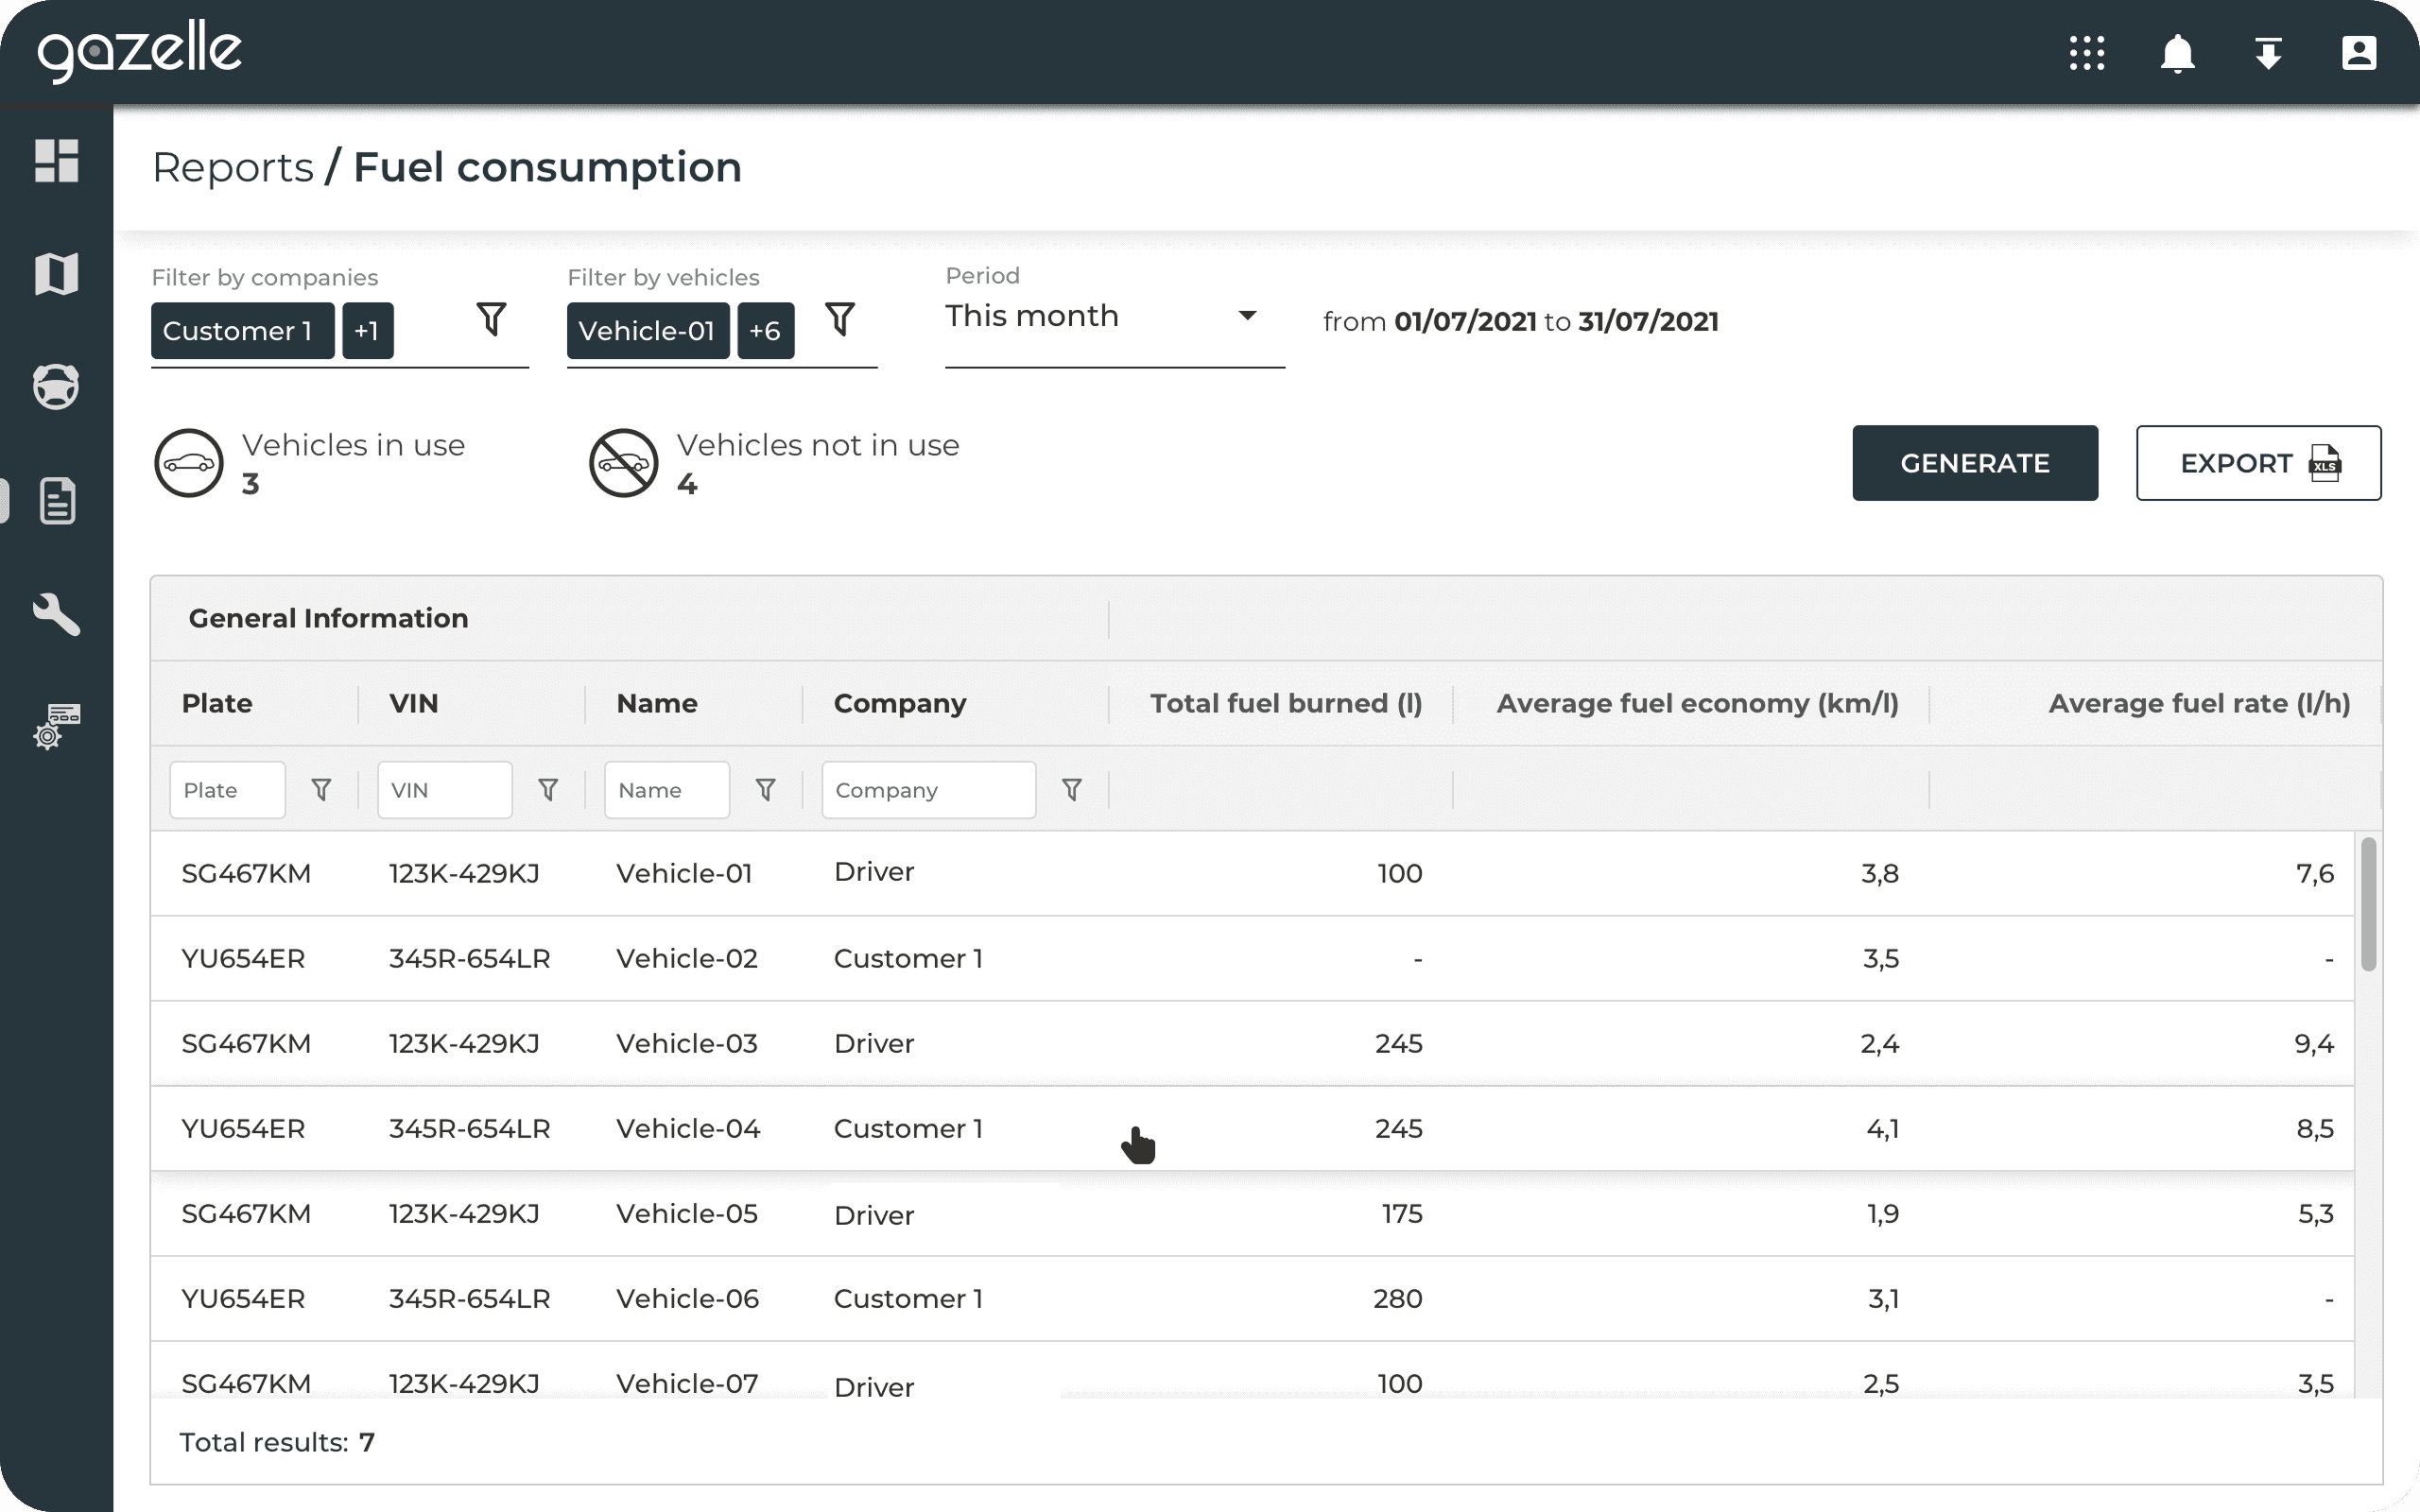
06 • Generated reports
Reports could be consulted directly inside the platform or scheduled for periodic delivery via email. Built for stakeholders who need fleet usage, driver behavior, maintenance status and fuel consumption data, with the flexibility to access it on-demand or receive it automatically.
MY CONTRIBUTION
Designed the report templates, the data hierarchy across categories, and the configuration flow that lets users define what each scheduled report contains and how it's delivered.
Five years, one product
Continuous contribution across feature releases and product evolutions, working in tight collaboration with product, development and QA teams.
Five verticals shipped
Features designed and shipped across all five Gazelle verticals (rental, insurance, finance, services and logistics), each with distinct workflows.
A design and dev partnership
Built a structured collaboration model with developers that turned design handoff from a transaction into an ongoing conversation, reducing post release fixes.